Risk Radar: City Risk Analysis
Imagine planning a move — whether you're a Teacher, a recent college grad, or even a business owner, balancing safety, affordability, and quality of life involves countless tradeoffs, and the decision is never easy. Our risk dashboard evaluates & visualizes current and future risks across cities and regions for various categories, such as natural disasters, crime, climate change, infrastructure, and cost of living.
Our Vision
With our shared vision to create a product that encompasses major aspects of risk within communities, we channeled our skills learned through technical and theoretical coursework in UX/UI, Front-End Development, GIS, and Data Management to create a cohesive dashboard that uniquely and effectively communicates crime levels, cost of living, infrastructure quality, and the impact of natural disasters in an interactive and visually appealing website using Figma, ArcGIS Pro & Online, JS React, and ethnographic research practices.
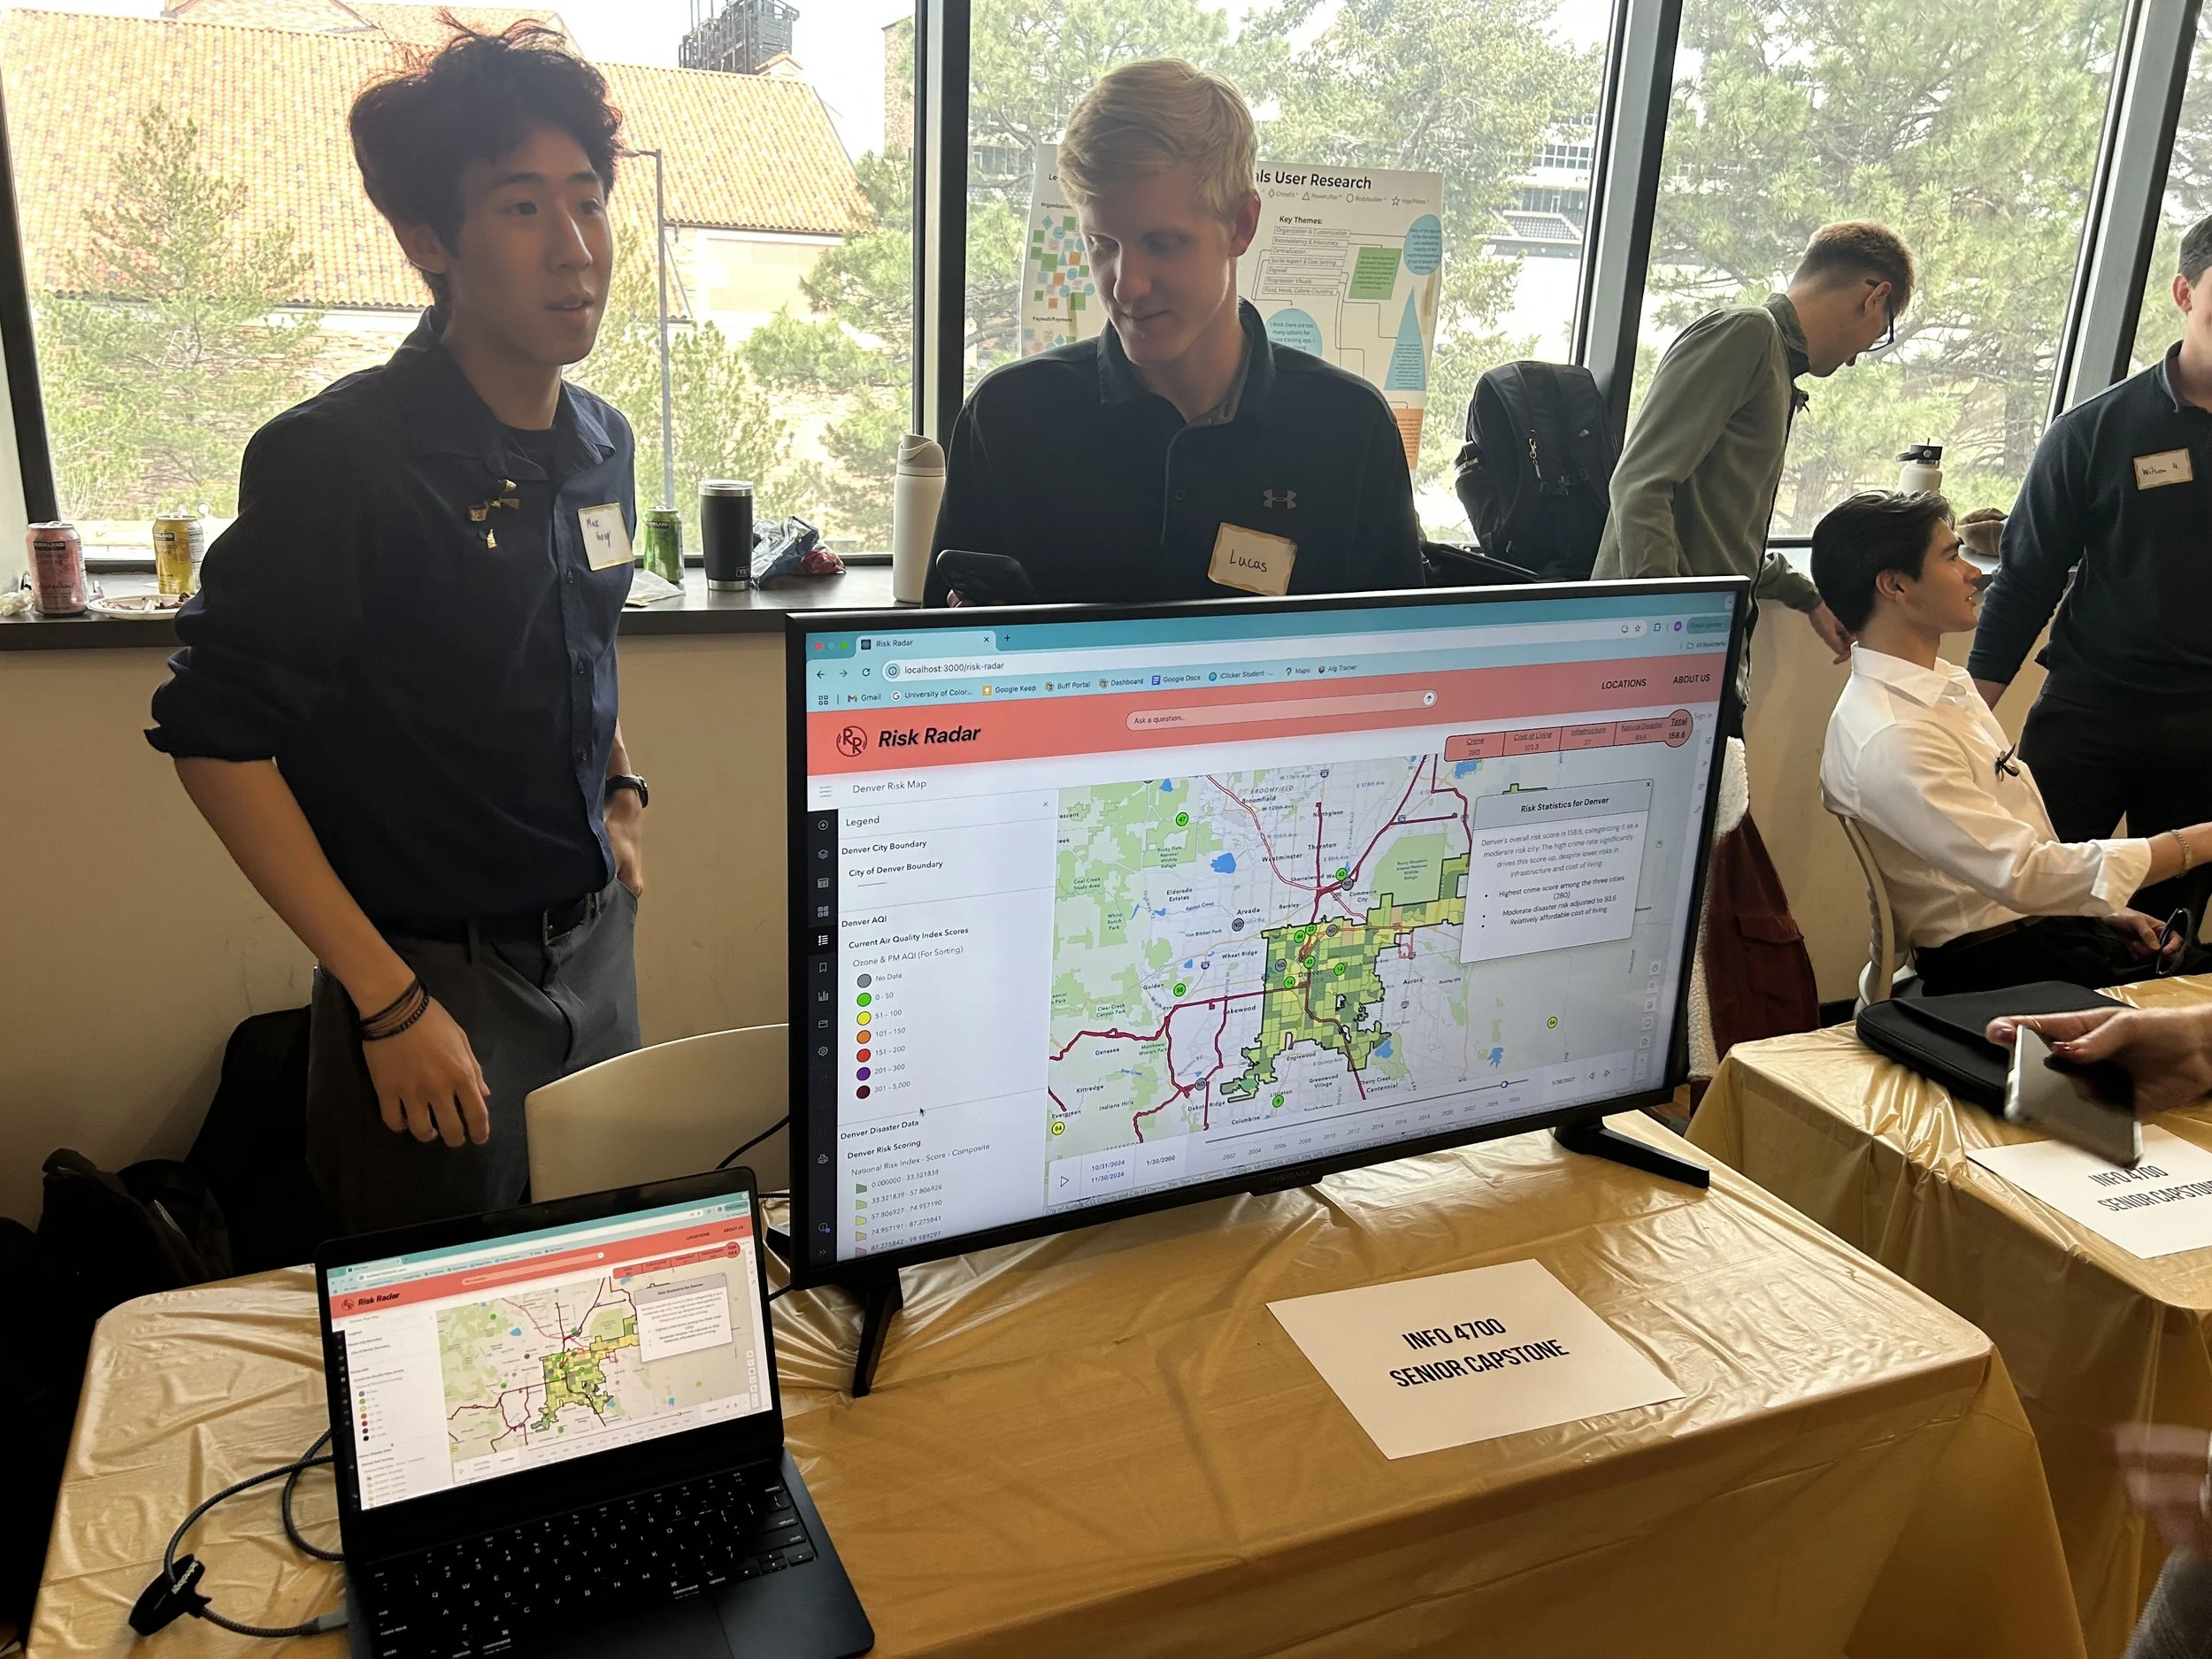
An intelligent Dashboard
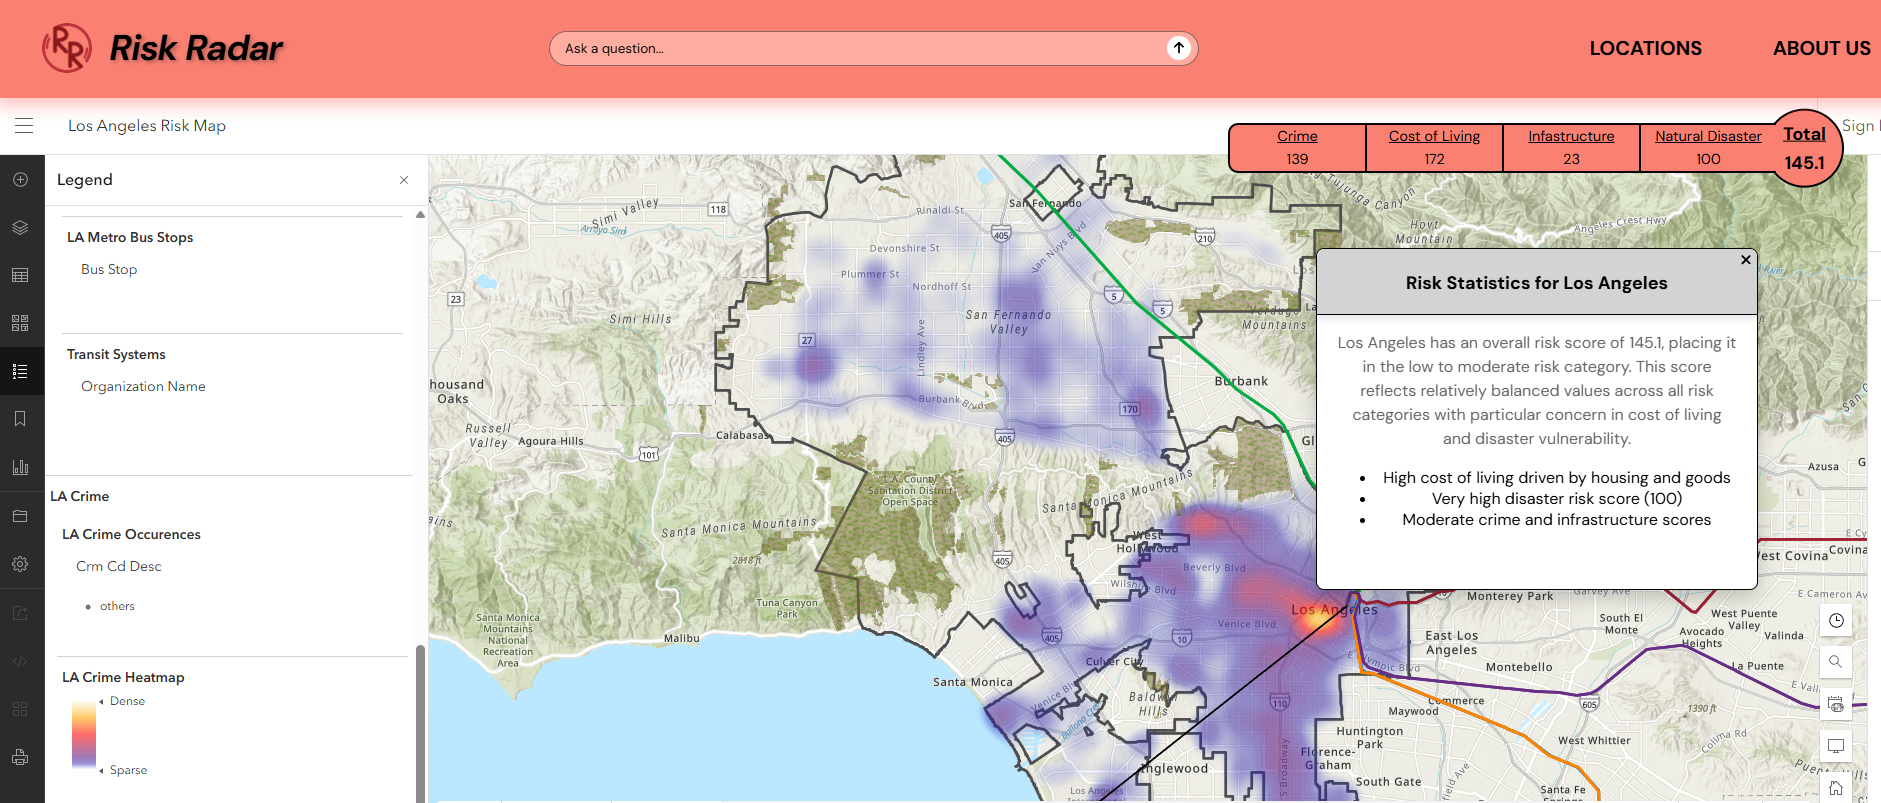
The project goal was to develop a comprehensive, map-based web application designed to provide insightful risk analysis for cities. This platform was built to offer users more than just summary statistics by delivering intelligent, context-aware responses about a city's risk landscape.
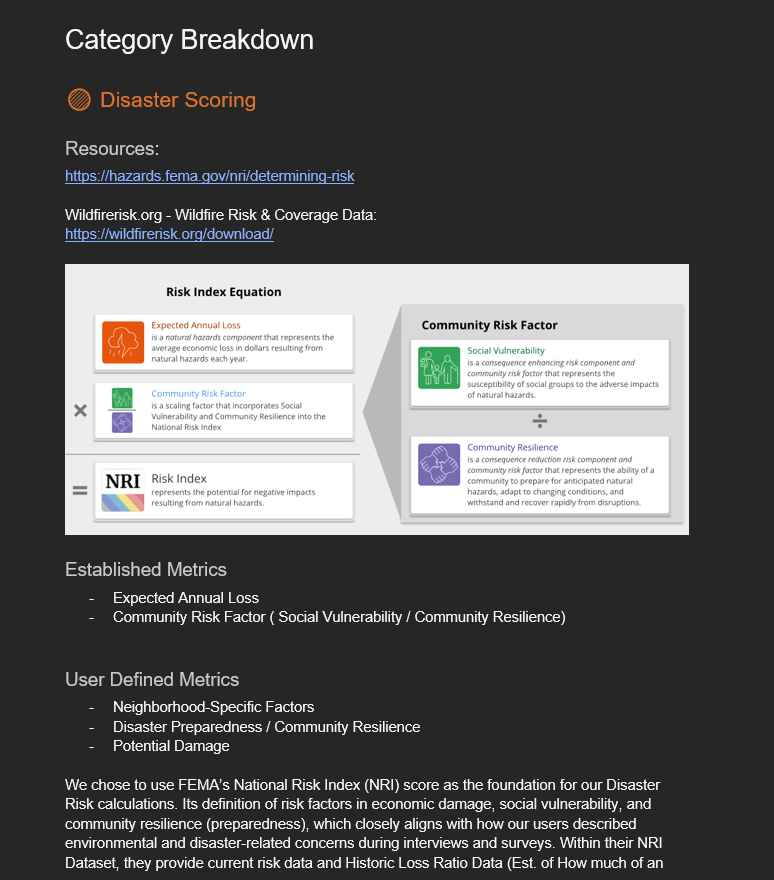
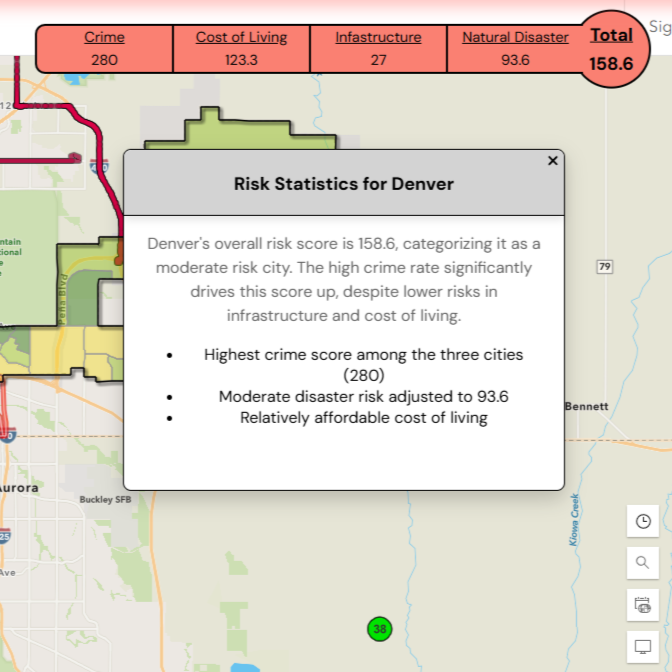
Scoring Methodology
Our scoring methodology was created by utilizing a combination of our user research and existing research performed by other groups. For specific categories, risk scores are calculated using a unique formula based on factors identified in interviews, surveys, and other risk formulas (NRI). With our overall risk score being calculated by combining and weighing all categories together and assigning an overall risk score. We go further in-depth and explain our entire scoring system in our Risk Scoring Methodology document linked below.